Description
Stock Forecasting Indicator: Trend Probability Map
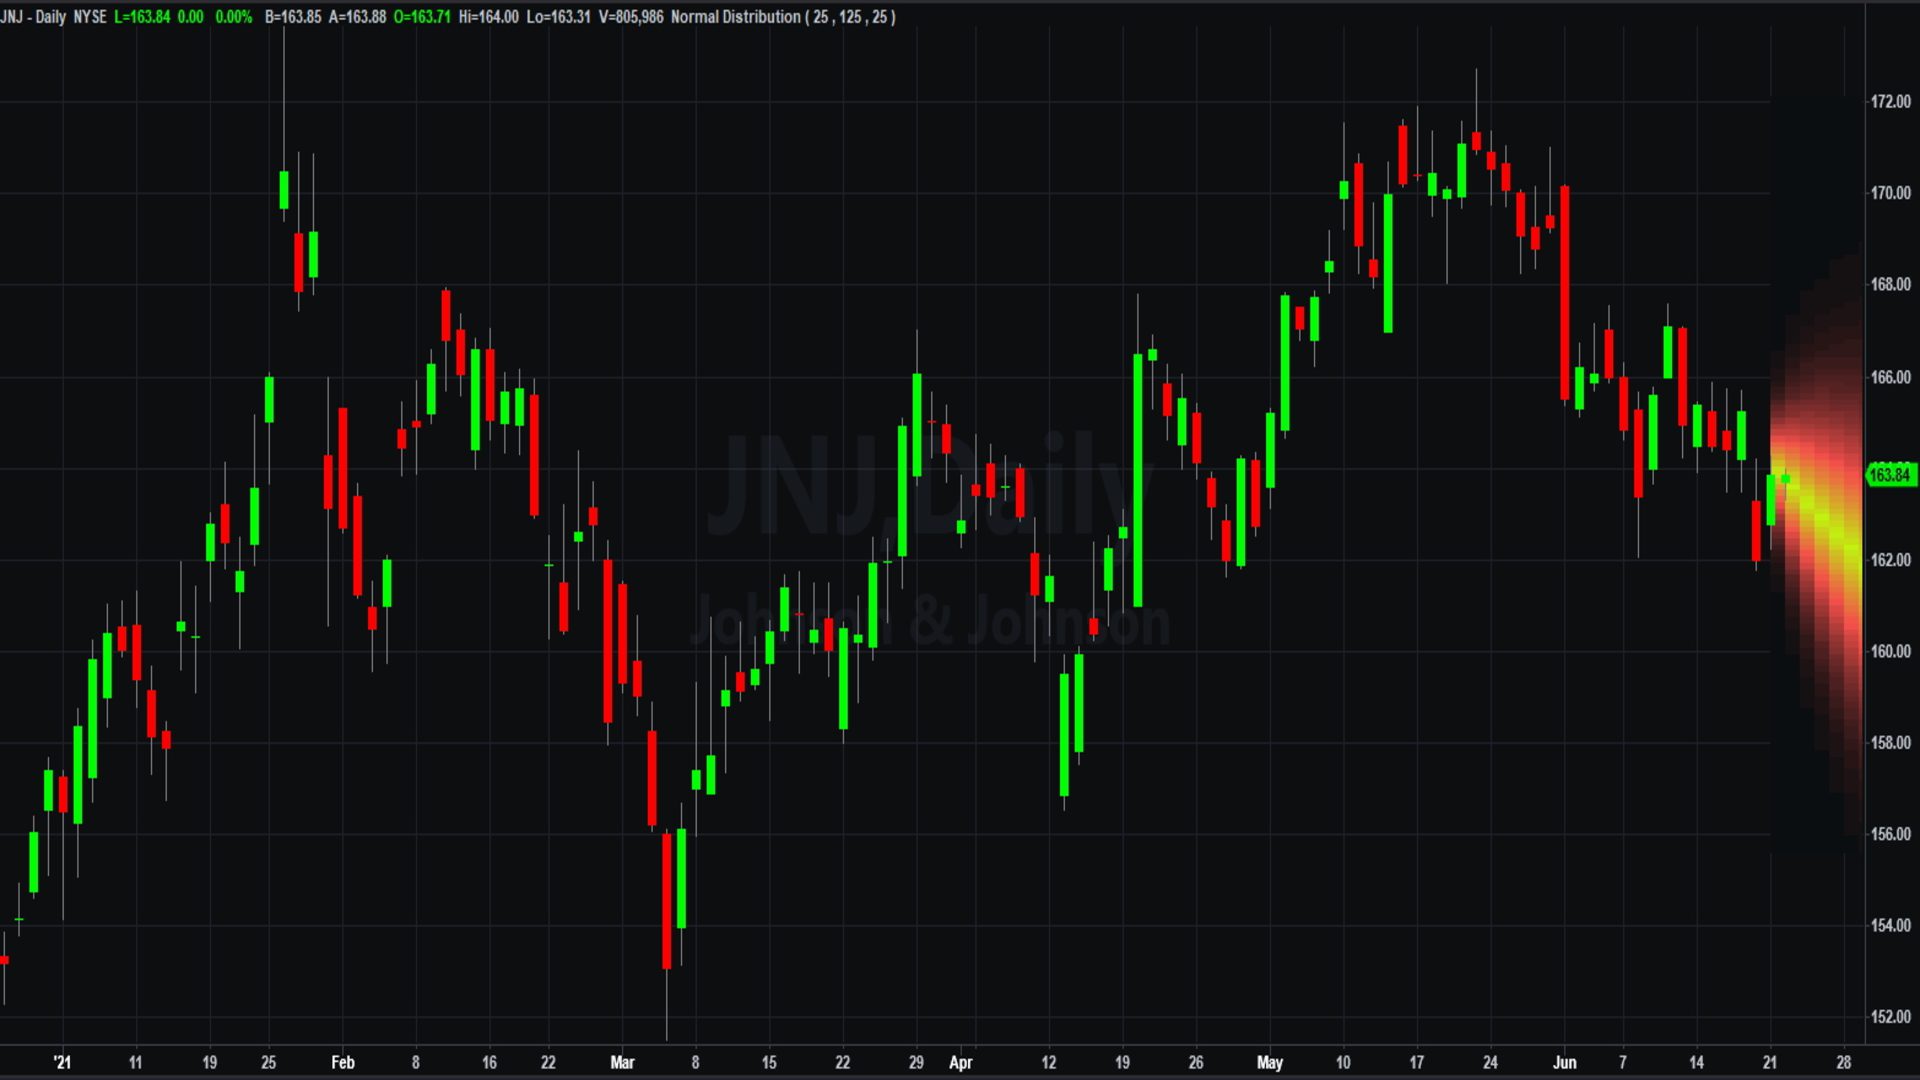
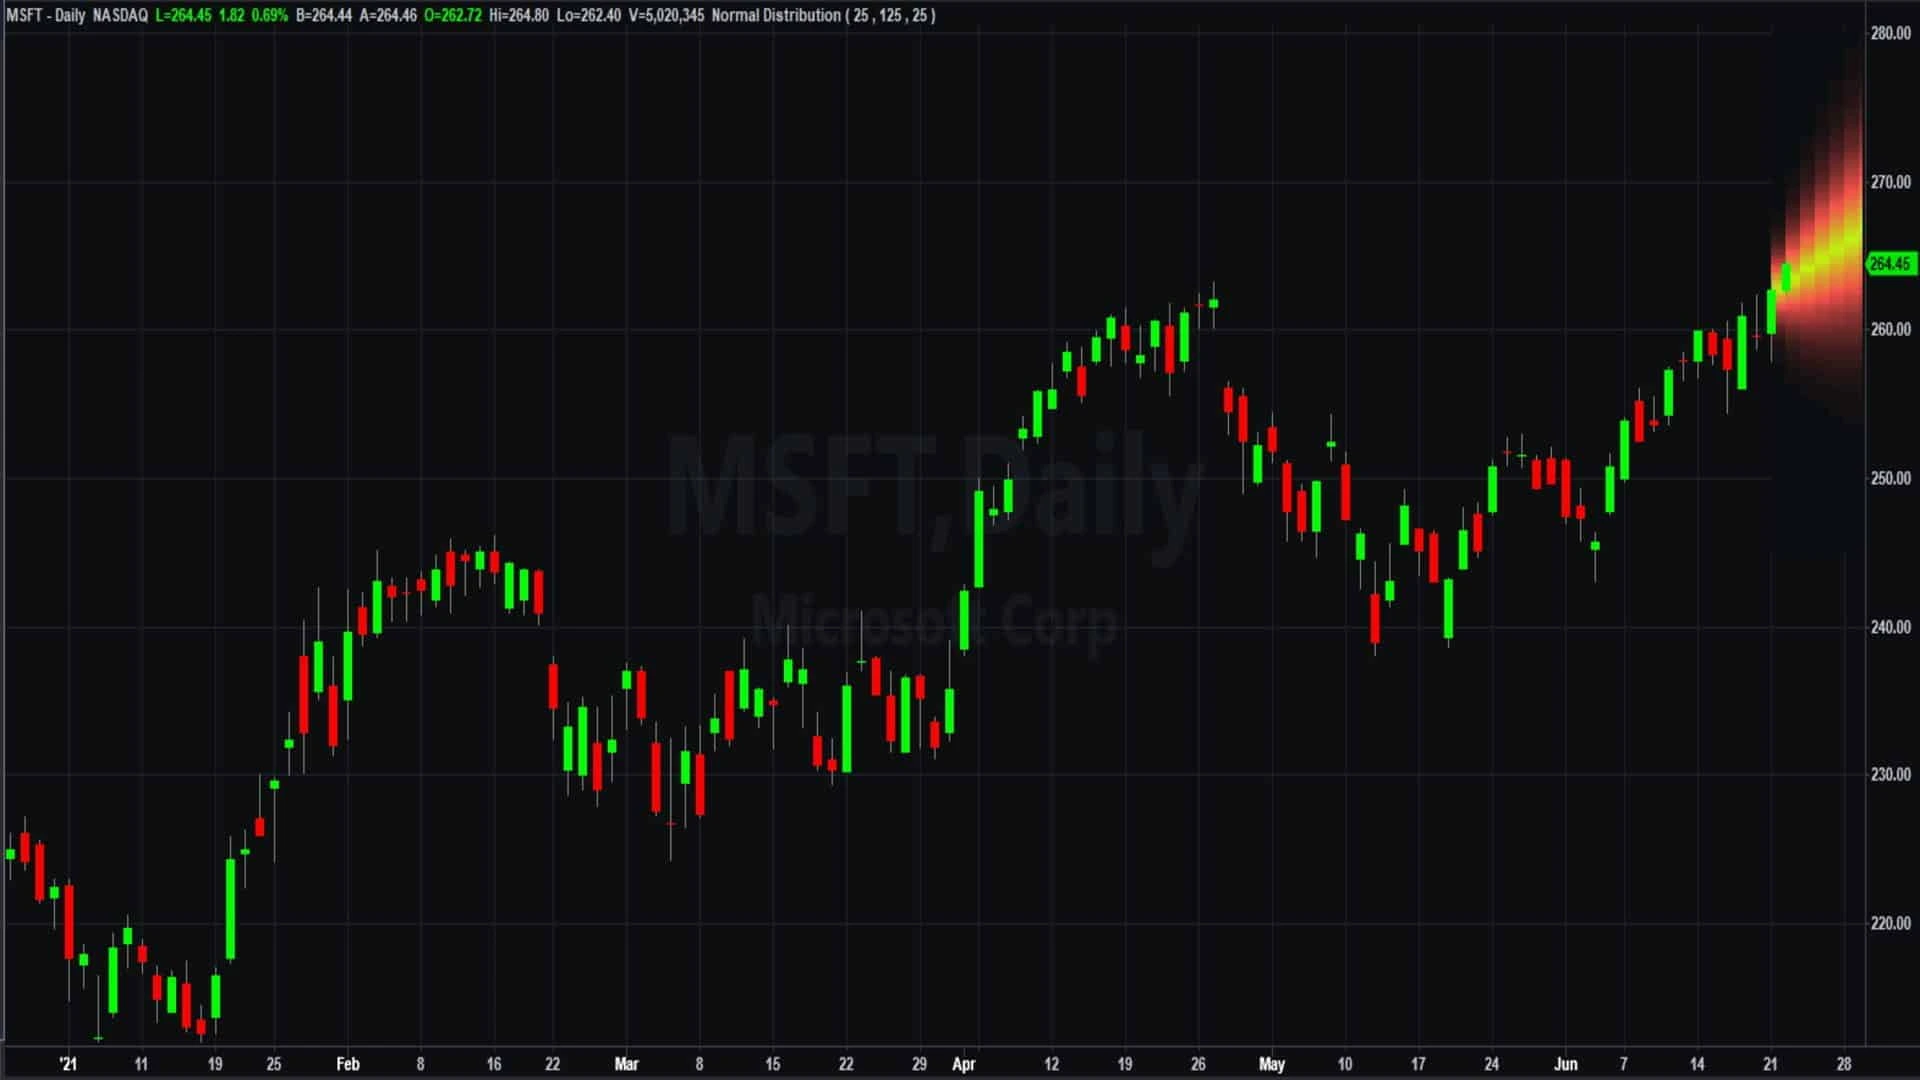
The Stock Forecasting Indicator Trend Probability Map is a powerful tool designed for traders seeking to forecast trends in stocks, futures, and currencies. Operating on the TradeStation platform, it leverages linear regression to predict price movements, while the Probability Map visually illustrates potential forecast errors. This feature helps traders gauge potential price boundaries and enhances strategy planning.
The indicator is versatile and suitable for daily, weekly, and monthly timeframes, making it adaptable to various trading styles. By using this tool, traders can obtain clear insights into market dynamics and adjust their positions based on reliable data. This improved visibility allows for more confident decision-making, whether you’re dealing with stocks, futures, or currencies.
How to Install and Start Using the Trend Probability Map
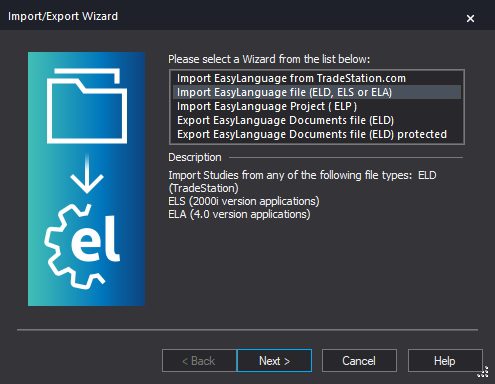
To begin, simply download the indicator and import it into the TradeStation “ProbabilityMap” folder. This process takes only a few moments, enabling you to start using the tool quickly. With easy setup and intuitive design, traders of all experience levels can benefit from this indicator’s powerful features.
Share Your Results and Improve Together
We value user feedback and encourage you to share your successes and suggestions. Engage with us on our YouTube channel, where you can leave comments and help other traders benefit from your experiences. Your insights help us continuously improve the indicator and create a community of traders who strive for success.
With its precise forecasting and visual aids, the Stock Forecasting Indicator Trend Probability Map can be a key asset in your trading toolkit.

Download and import to folder: ProbabilityMap.
Demo Video


